> ## Documentation Index
> Fetch the complete documentation index at: https://docs.compasslabs.ai/llms.txt
> Use this file to discover all available pages before exploring further.
# Dashboards
> Build risk dashboards, rate comparisons or portfolio views from the same data the API serves. Two examples are live on compasslabs.ai.
Everything the API returns is plain JSON, so you can build whatever your users need on top of it: a risk dashboard, a rate comparison, a treasury report, a portfolio view. We build ours the same way. Two are live on compasslabs.ai, so you can see the data at work before you write any code.
## Rate History
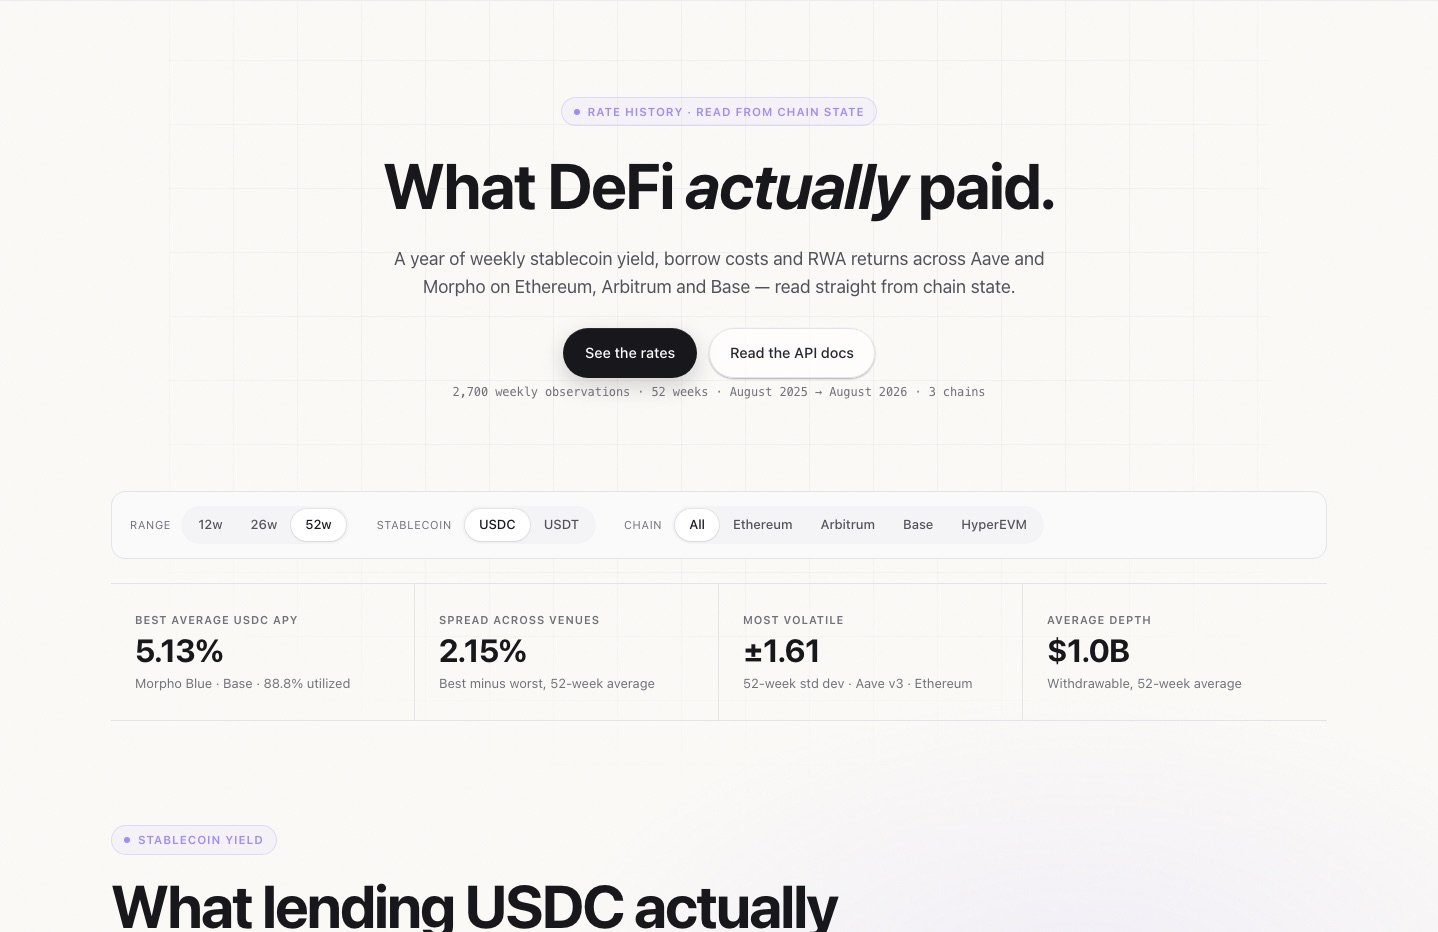
[compasslabs.ai/rates](https://www.compasslabs.ai/rates) shows what DeFi actually paid: a year of weekly stablecoin yield, borrow costs, RWA returns and the leverage those rates support, across Aave and Morpho on Ethereum, Arbitrum and Base. It's built from the same on-chain data the API reads, sampled weekly. Pick a range (12, 26 or 52 weeks), a stablecoin (USDC or USDT) and a chain, then compare the best average APY, the spread between venues, volatility and withdrawable depth.
 ## Risk Dashboard
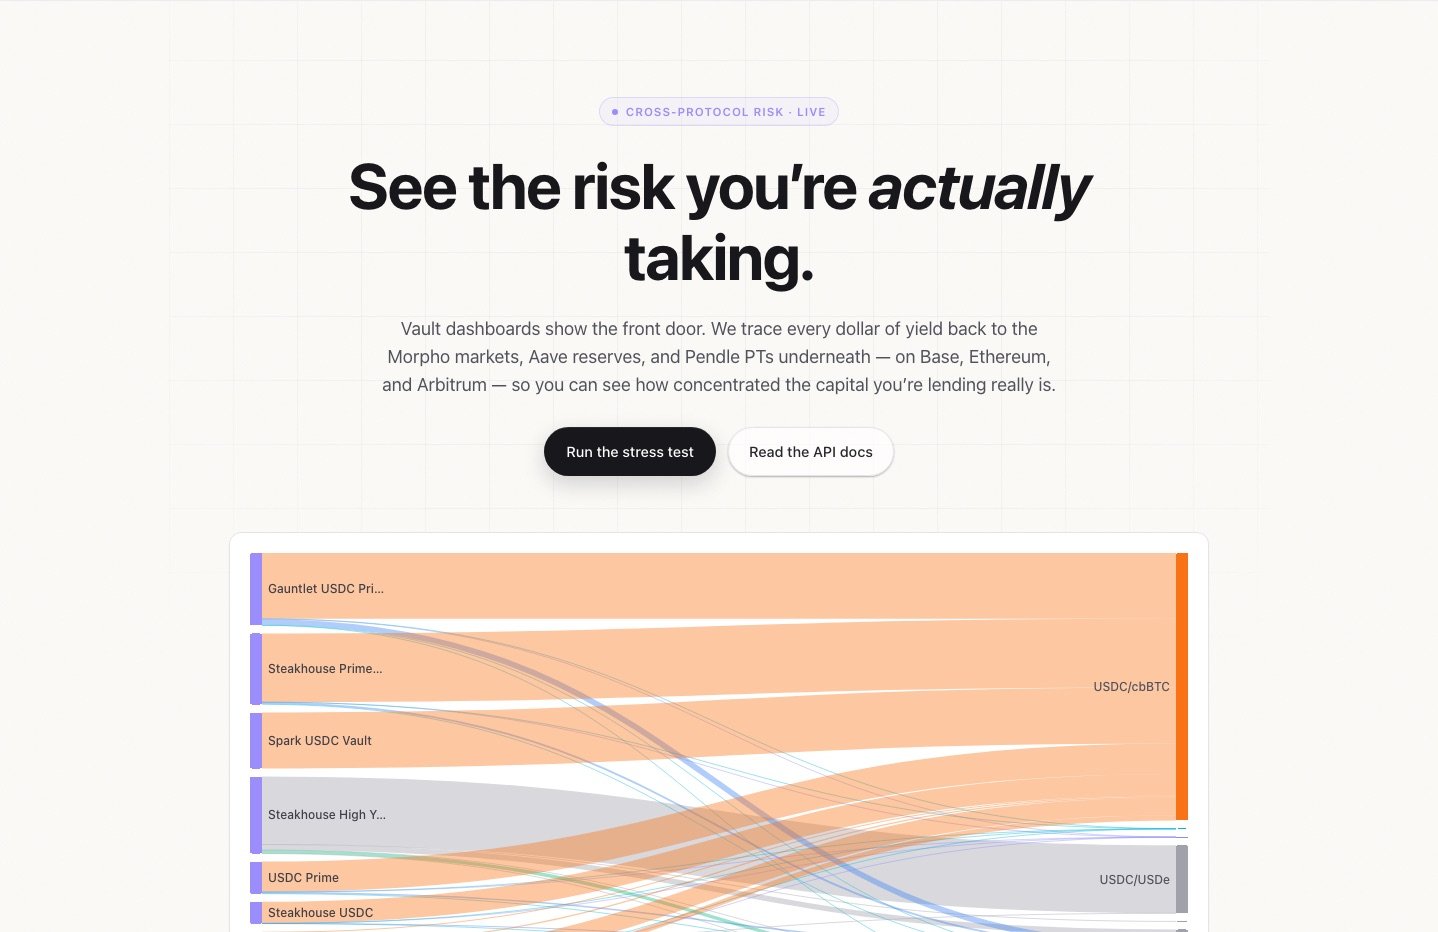
[compasslabs.ai/risk](https://www.compasslabs.ai/risk) shows the risk behind the yield. It traces every dollar in the major vaults back to the Morpho markets, Aave reserves and Pendle PTs underneath, on Base, Ethereum and Arbitrum, so you can see how concentrated the capital really is. It includes a Sankey of where vault deposits go, correlation between venues, leverage, a cascade stress test, risk-adjusted yield and vault economics. It reads live from the [market data](/v2/data/market-data) endpoints you can call yourself.
## Risk Dashboard
[compasslabs.ai/risk](https://www.compasslabs.ai/risk) shows the risk behind the yield. It traces every dollar in the major vaults back to the Morpho markets, Aave reserves and Pendle PTs underneath, on Base, Ethereum and Arbitrum, so you can see how concentrated the capital really is. It includes a Sankey of where vault deposits go, correlation between venues, leverage, a cascade stress test, risk-adjusted yield and vault economics. It reads live from the [market data](/v2/data/market-data) endpoints you can call yourself.
 ## Build your own
Start with [Market Data](/v2/data/market-data) for venue-level numbers and [Balances and Positions](/v2/data/balances-and-positions) for each user's holdings. Both need only an API key.
## Build your own
Start with [Market Data](/v2/data/market-data) for venue-level numbers and [Balances and Positions](/v2/data/balances-and-positions) for each user's holdings. Both need only an API key.